
Questions? Follow @TimeformUSFigs on Twitter and let us know.
TimeformUS Speed Figures for the Journey to the 2018 Triple Crown
Click on the chart to make it a lot bigger.

Here’s the same chart but for the 3-yr-old filly division:
Click on the chart to make it a lot bigger.

Some background on TimeformUS Speed Figures relevant to the above chart:
- How TimeformUS Speed Figures work
- How TimeformUS Pace Figures work
- How TimeformUS Color-Coded Fractions/Pace Figures work
- How TimeformUS Bias Indicators work
Historic Data:
Complete 2017 Triple Crown Journey Chart:

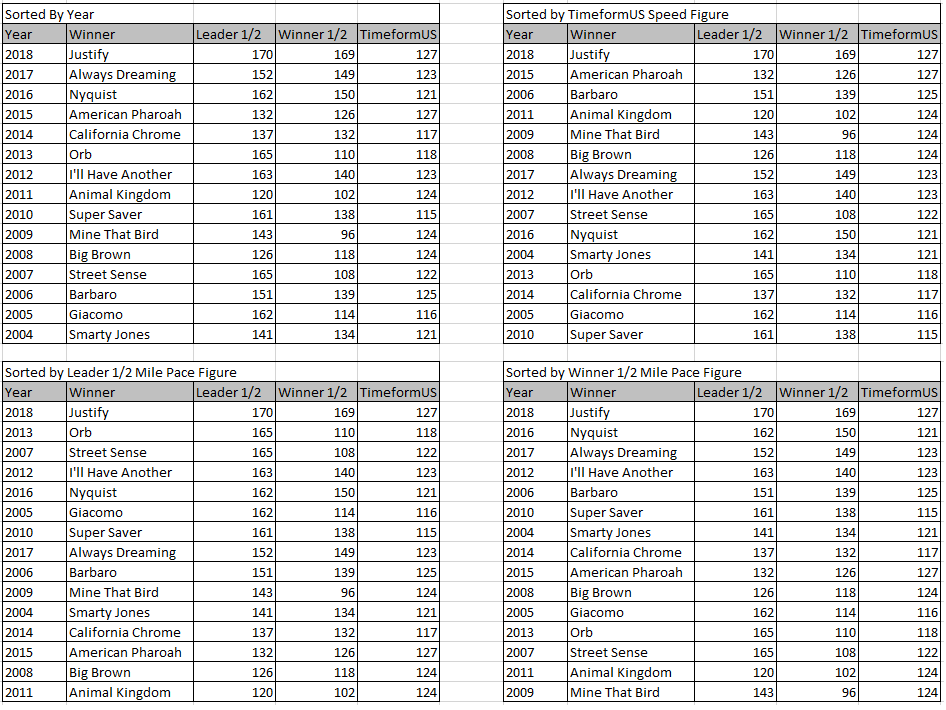
Kentucky Derbies 2004-2018, sorted 4 ways: By year, ranked by Top TimeformUS Speed Figure, By fastest pacesetter (first 1/2 mile), by fastest eventual winner (first 1/2 mile):
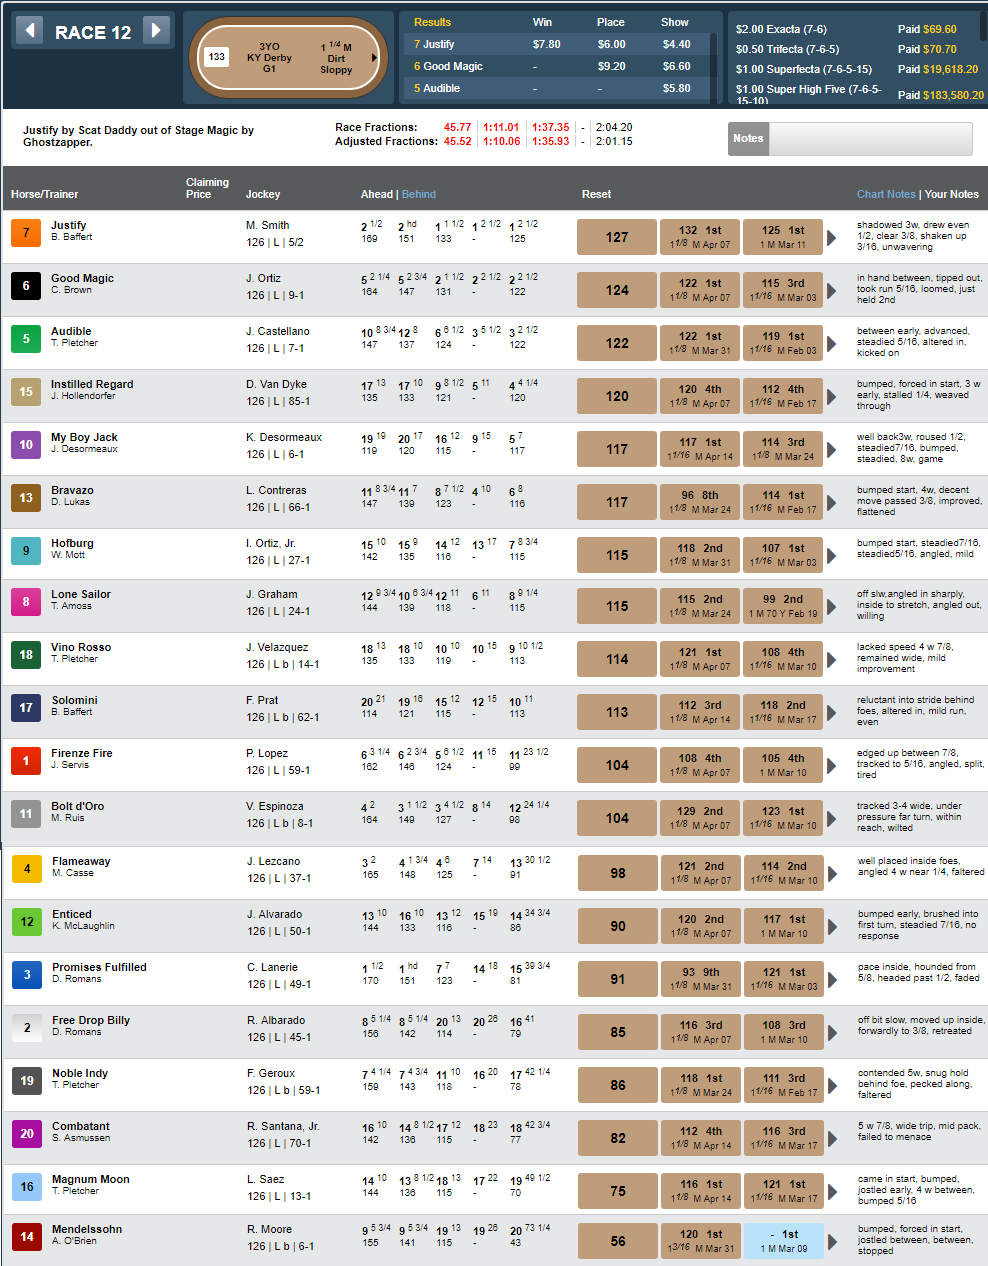
2018 Kentucky Derby Chart, with each horse’s internal TimeformUS Pace Figures and Final TimeformUS Speed Figure. Note the lengths beaten is the view you’ll see in the PPs when these horses next race.
Historic Triple Crown Series Figures: Further back, 2010-2016
Click on the chart to make it a lot bigger.

- This is a look at the winning TimeformUS Speed Figures
for the last 7 years of Triple Crown prep races as well as the winning figures f or the Kentucky Derby, Preakness, and Belmont Stakes for each 0f those years.
 - The top TimeformUS Speed Figure for any Triple Crown season’s race of the last 7 years was I’ll Have Another’s 130 in the Preakness. The Factor ran the same figure in 2011 Southwest.
- The Southwest at Oaklawn was run in 2 divisions in 2012; we’ve used the higher TimeformUS Speed Figure for the above chart.
- The 2016 Sunland Derby was cancelled.
